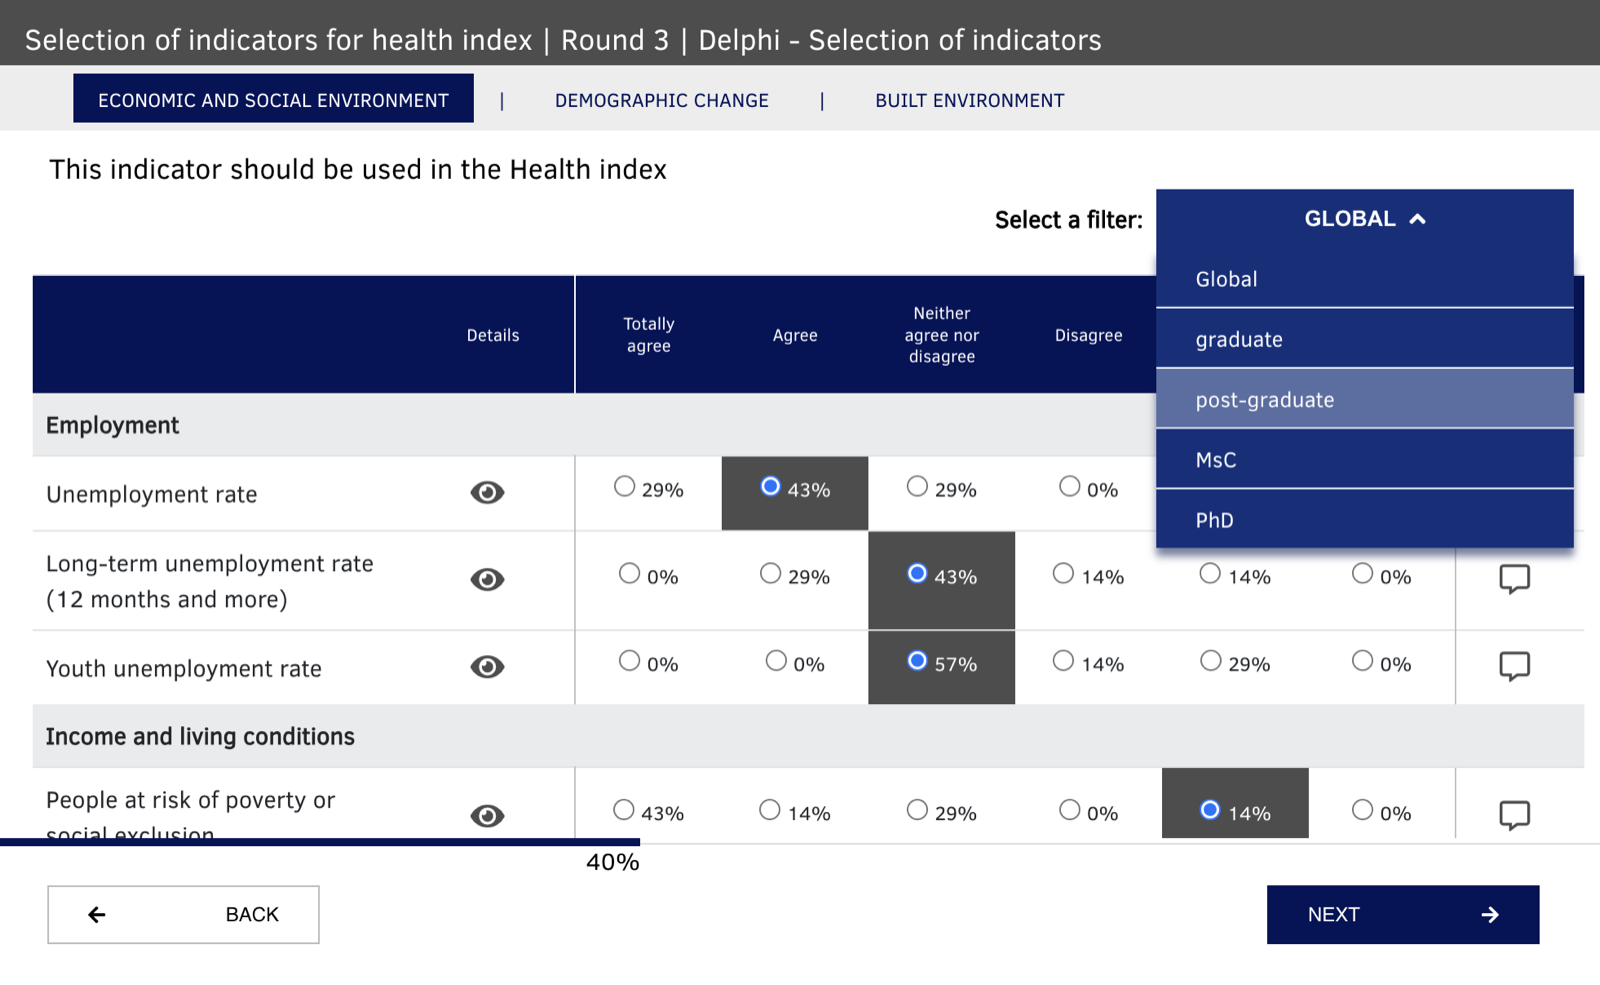
Letting participants filter statistics by group
In qualitative pages, Welphi lets the participants view the previous round's statistics to help them decide whether to change their previous answer. Participants can switch between percentages and number of participants with "Show stats as: PERCENTAGE / ABSOLUTE".
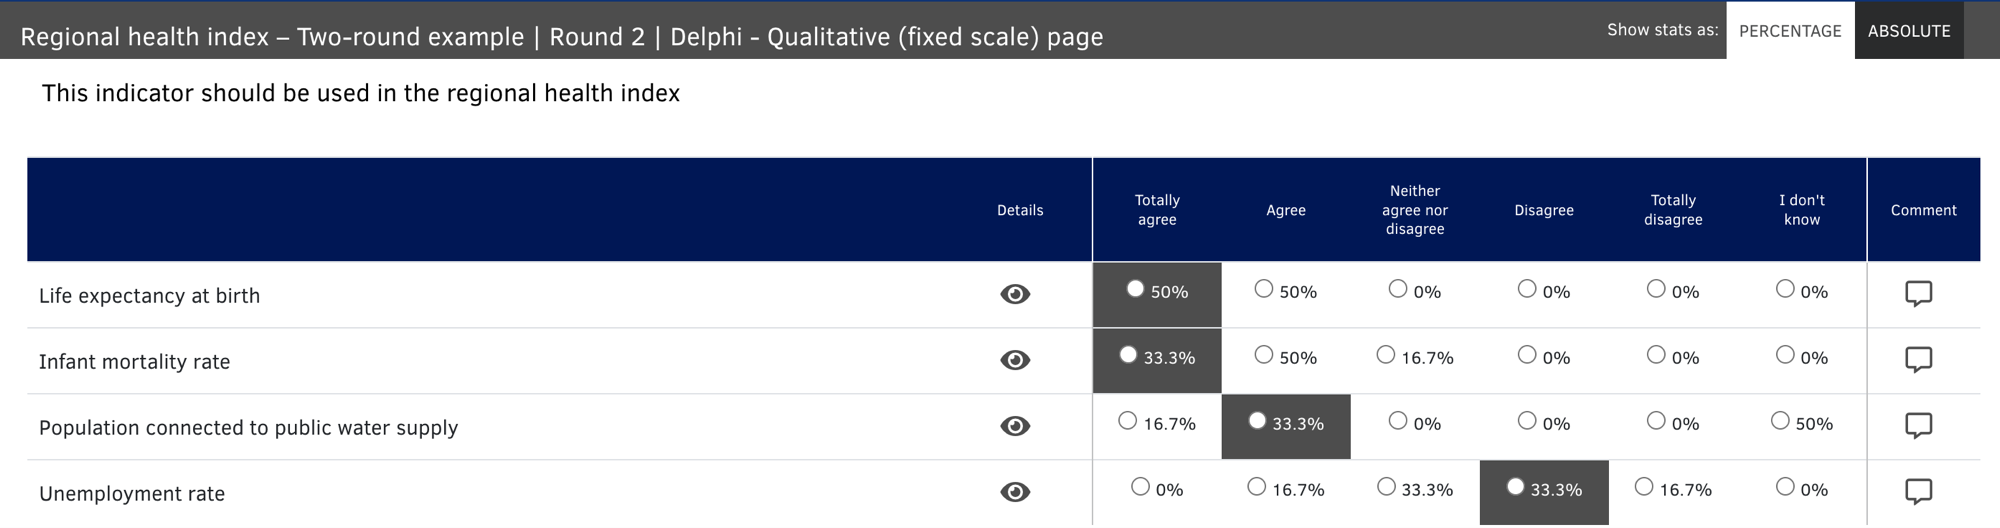
To further help the participants, you can also allow them to filter the statistics based on the group they belong to. This article shows you how.
Note: letting participants filter the statistics is part of the Premium plan. As process admin, you can always filter your own results by group, on every plan, on the "Round results" page (see Analysing the results of a qualitative page).
Overview
Setting up statistics filtering takes four steps:
- Define how your participants are grouped.
- Open the "STATISTICS" section of the qualitative page.
- Add a filter, based on a custom participant field or a closed survey question.
- Check how participants use the filter.
1. Define the participant groups
In Welphi, the participant group can be defined in two ways:
- Participant custom field – when you already know to which group a participant belongs, you can use a participant custom field (the "Custom fields" button on the Participants page) to create a group field and fill it in for each participant (see Adding and managing participants).
- Closed question on a survey page – if you want the participants to tell you which group they belong to during the questionnaire, add a survey-type page with a closed-ended question inside. This way, the participants can select which group they belong to among the possible options you have created.
Once you have told Welphi how to group your participants, you can set up your filtering options on the qualitative page.
2. Open the STATISTICS section
The filter options are located in the qualitative page's left setup panel under "STATISTICS".
Note: This section will only appear if the previous round also included the page you are working on.
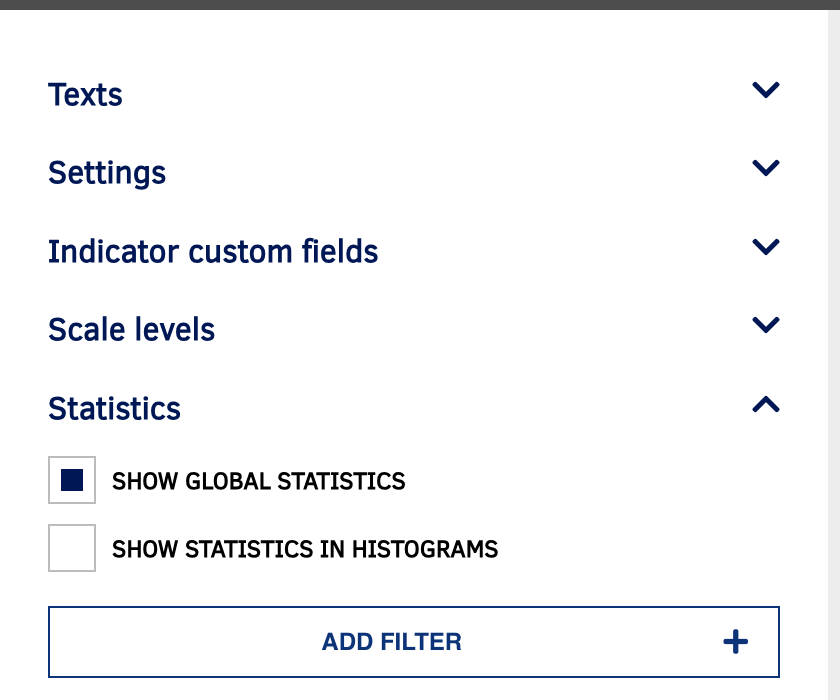
The section has two options and the "ADD FILTER" button:
- "SHOW GLOBAL STATISTICS" – see below.
- "SHOW STATISTICS IN HISTOGRAMS".
Please keep in mind that these settings can only be changed before the round starts.
Global statistics
By default, the "SHOW GLOBAL STATISTICS" checkbox will be checked so that your participants can see the global statistics, i.e., the statistics built using all the answers regardless of any group setting.
Please note that the process setting "Include answers from uncompleted questionnaires across rounds" may change the information shown in the global statistics; see Choosing your process settings.
3. Add a filter
To allow participants to filter the statistics visible on the page, click on the "ADD FILTER" button.
As explained above, the statistics can be filtered by the participants' groups. These groups are defined by a "custom participant group" or a question on a survey page. The first box in the filter setup panel lets you choose which one to use. Follow the steps for your choice below.
Using a custom participant field as a filter
-
Select the source for the filter options. Let's start by choosing "CUSTOM PARTICIPANT FIELD".
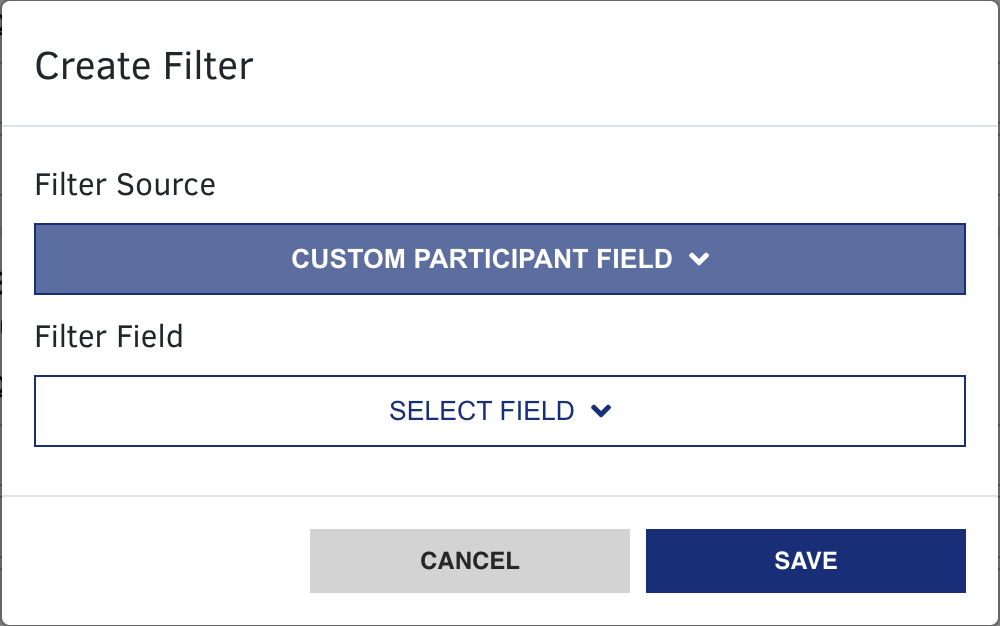
Filter setup popup -
Select the field for the filter options. Now that we have selected the origin, we need to choose the field to use as a filter. Let's pick the "Group" field (note: this field was previously created in the participants window).

Filter setup popup (Field selection) -
Select the possible options. Once the field is selected, Welphi will show you the possible existing field values.
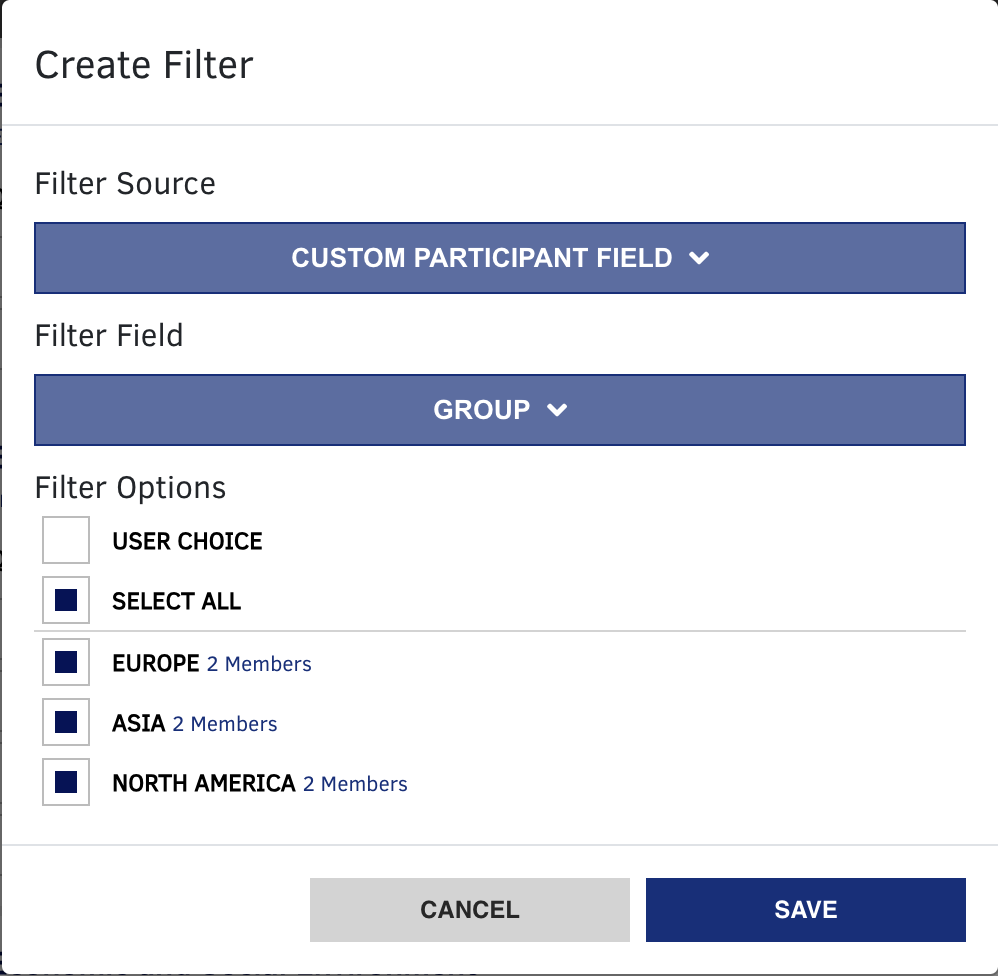
Filter setup popup (Options selection)
About the options list:
- Values – the software automatically creates a list of fields based on the values associated with each participant on the participant's page.
- Group size – Welphi will present the number of participants who are members of each group. In this case, we can see that there are two members of the "Europe" group, two members of the "Asia" group, and two members of the "North America" group.
- Default selection – all groups will be selected, which means participants can filter the statistics by any of these groups.
The "USER CHOICE" option
You may have noticed that the first option is, in fact, "USER CHOICE". This option will allow participants to see which group they belong to when they open the filter box.
If you uncheck all other boxes and only leave this one checked, all participants will see the statistics based only upon the answers from people belonging to the same group as the participant. If "SHOW GLOBAL STATISTICS" is also selected, participants can choose that filter too.
Please keep in mind that when only one filter option is selected, Welphi will automatically apply that filter and hide the filter box for participants.
Using a closed survey question as a filter
This time, we will create the statistics filter by using a closed question on a survey page in our questionnaire.
-
Select the source for the filter options. In the filter source box, choose "CLOSED SURVEY QUESTION".

Filter setup popup (source selection) -
Select the page hosting the question. Welphi will list all survey pages in any previous round of your questionnaire where there is at least one closed-ended question. In this example we are selecting the question "Round 1: Page 3. Demographics".
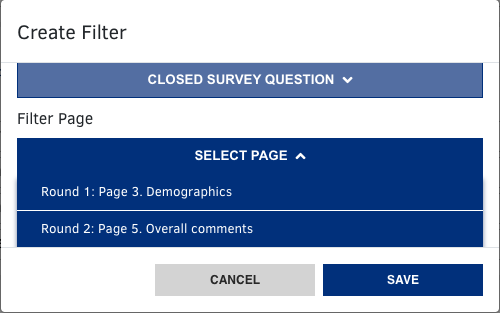
Filter setup popup (page selection) -
Select the question to filter the statistics. Select the closed-ended question containing the options participants will use to filter the statistics. Welphi will list all the questions on the chosen page where at least one option is selected.
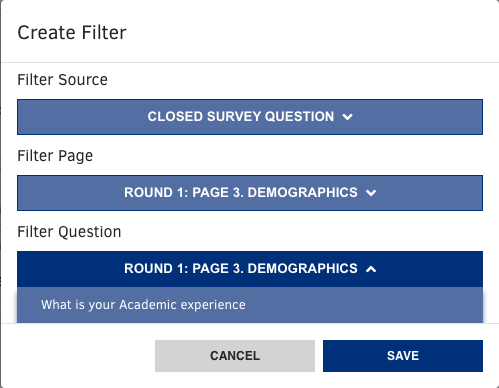
Filter setup popup (question selection) -
Select the possible answer options. Once the question is selected, Welphi will show you the possible answers. The software automatically presents the number of participants who have answered each one. For example, we can see that five participants answered "PhD".
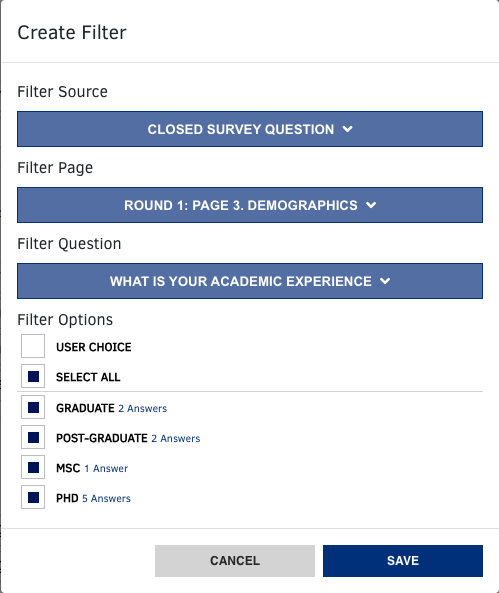
Filter setup popup (answers selection)
Note: If the same page exists in multiple rounds of your questionnaire, Welphi will only list the one in the most recent round.
4. Using the filter
Once you have defined your filter, participants can use it to filter the statistics they see on the page. Below is an example of how this looks on the qualitative page.