
Analysing the results of a qualitative page
When a round has answers, the "Round results" page shows the statistics of every indicator on a Delphi - Qualitative (fixed scale) page. Use it to follow the results, find the indicators that reached consensus, and decide what goes to the next round.
Overview
- Open the Round results page.
- Read the statistics table.
- Narrow down the list.
- Exclude "Unable to rate" answers from the statistics.
- Create approval and rejection rules.
- Check which indicators go to the next round.
1. Open the Round results page
- Open your process and go to the "Round details" screen of the round.
- Click the pie-chart icon ("View page analysis") next to the qualitative page.
The page shows the answers submitted so far, so you can use it while the round is still open.
A yellow warning at the top tells you whether answers from participants who did not complete the questionnaire are included. Click "here" in the warning to change this in Choosing your process settings.
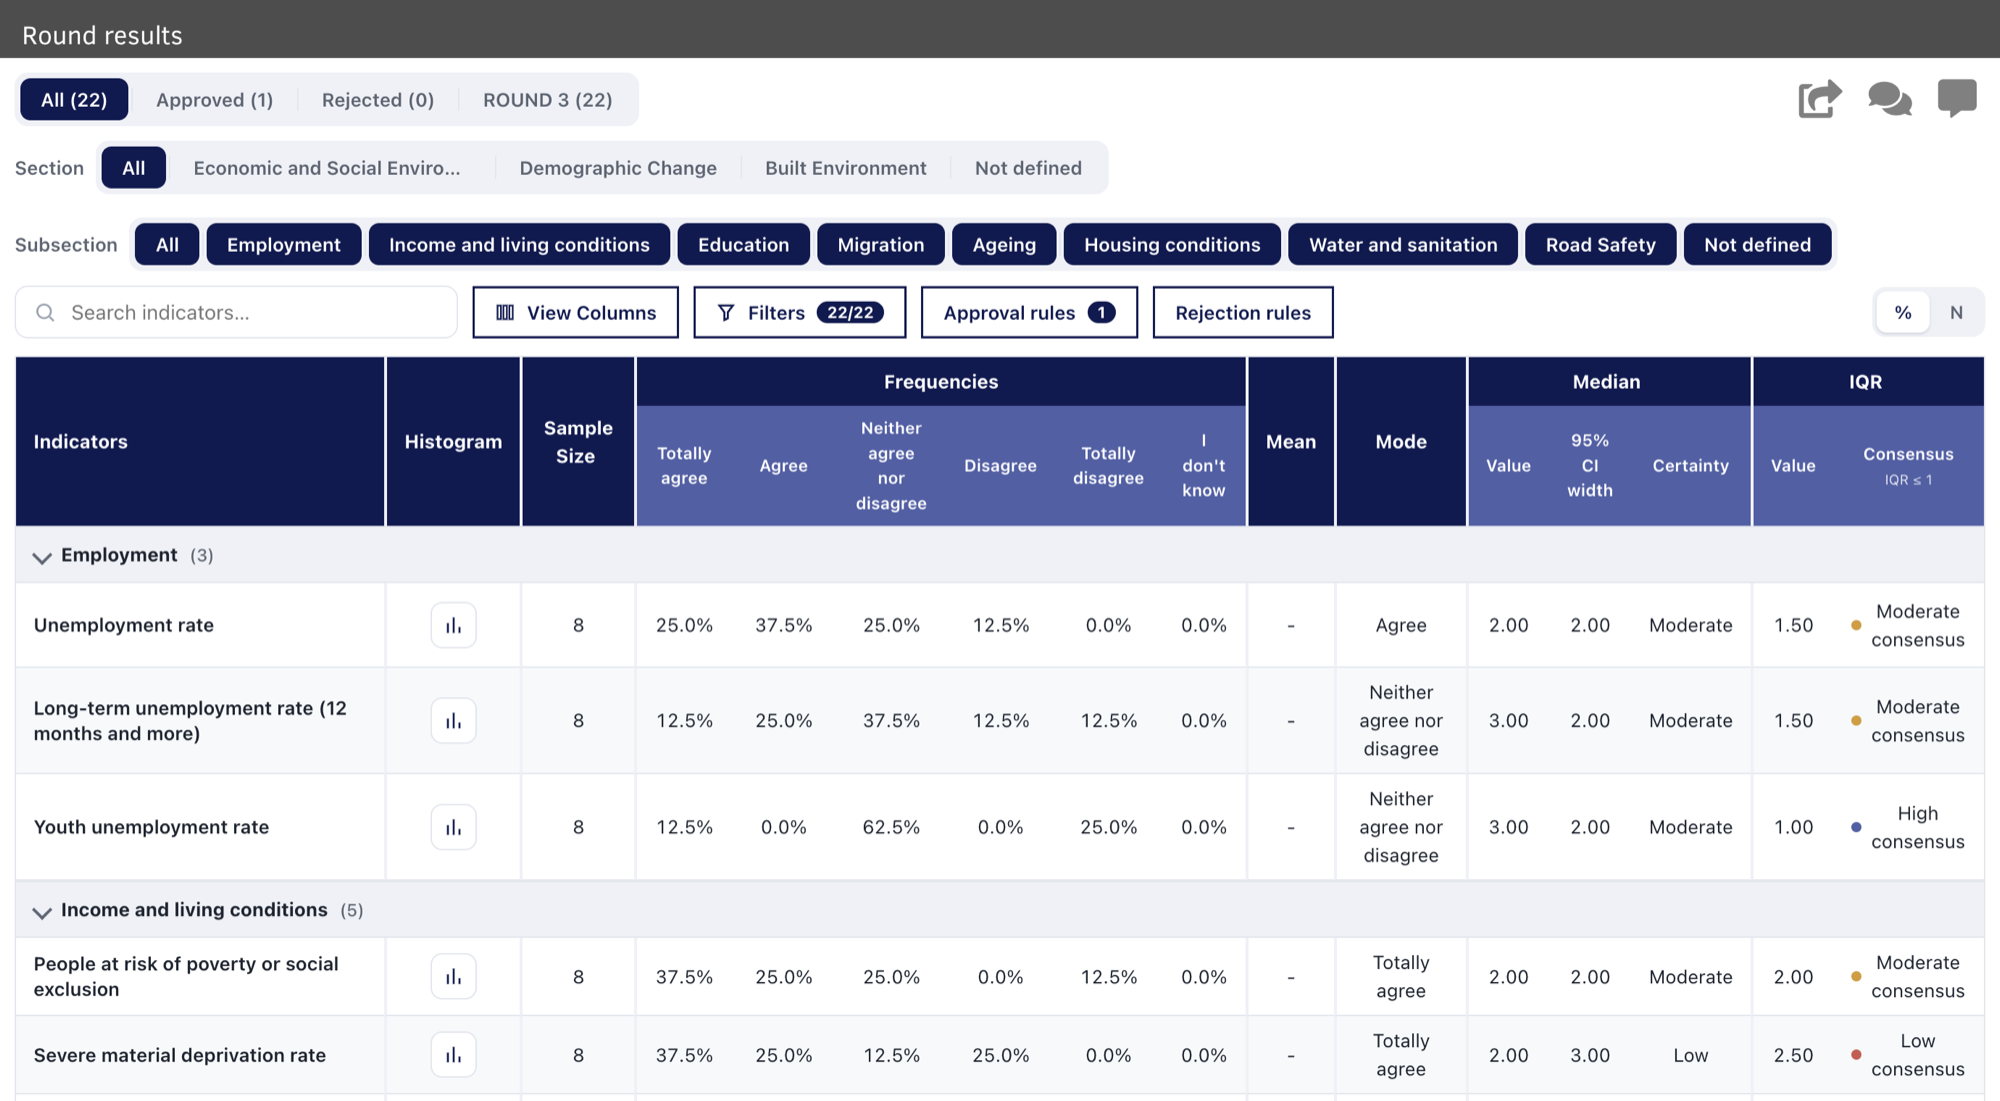
2. Read the statistics table
Each row is an indicator. Indicators are grouped by the subsections of your page (for example "Employment" or "Income and living conditions").
Columns
- Histogram – opens a chart of the answers for that indicator (see below).
- Sample Size – how many participants answered the indicator.
- Frequencies – the share of answers for each scale level. Use the "%" and "N" buttons at the top right to switch between percentages and number of answers.
- Mean – the average of the answers, calculated from the VALUE of each scale level. It is only shown if every scale level counted has a value – for example, exclude "I don't know" if that level has none (see Setting up a qualitative (fixed scale) page).
- Mode – the scale level chosen most often.
- Median – the middle answer ("Value"), with its "95% CI width" and "Certainty" (Low, Moderate or High).
- IQR – the interquartile range ("Value") and the level of consensus.
- Wilcoxon Signed-Rank – from round 2 on: whether the answers changed since the previous round ("p-value" and "Consensus"; see Stability between rounds below).
Level of consensus
The "Consensus" column uses the IQR: the smaller the IQR, the more participants agree with each other. An IQR of 1 or less ("IQR ≤ 1") means consensus. Each indicator gets a label from "Very high consensus" to "No consensus", with a coloured dot.
Histogram
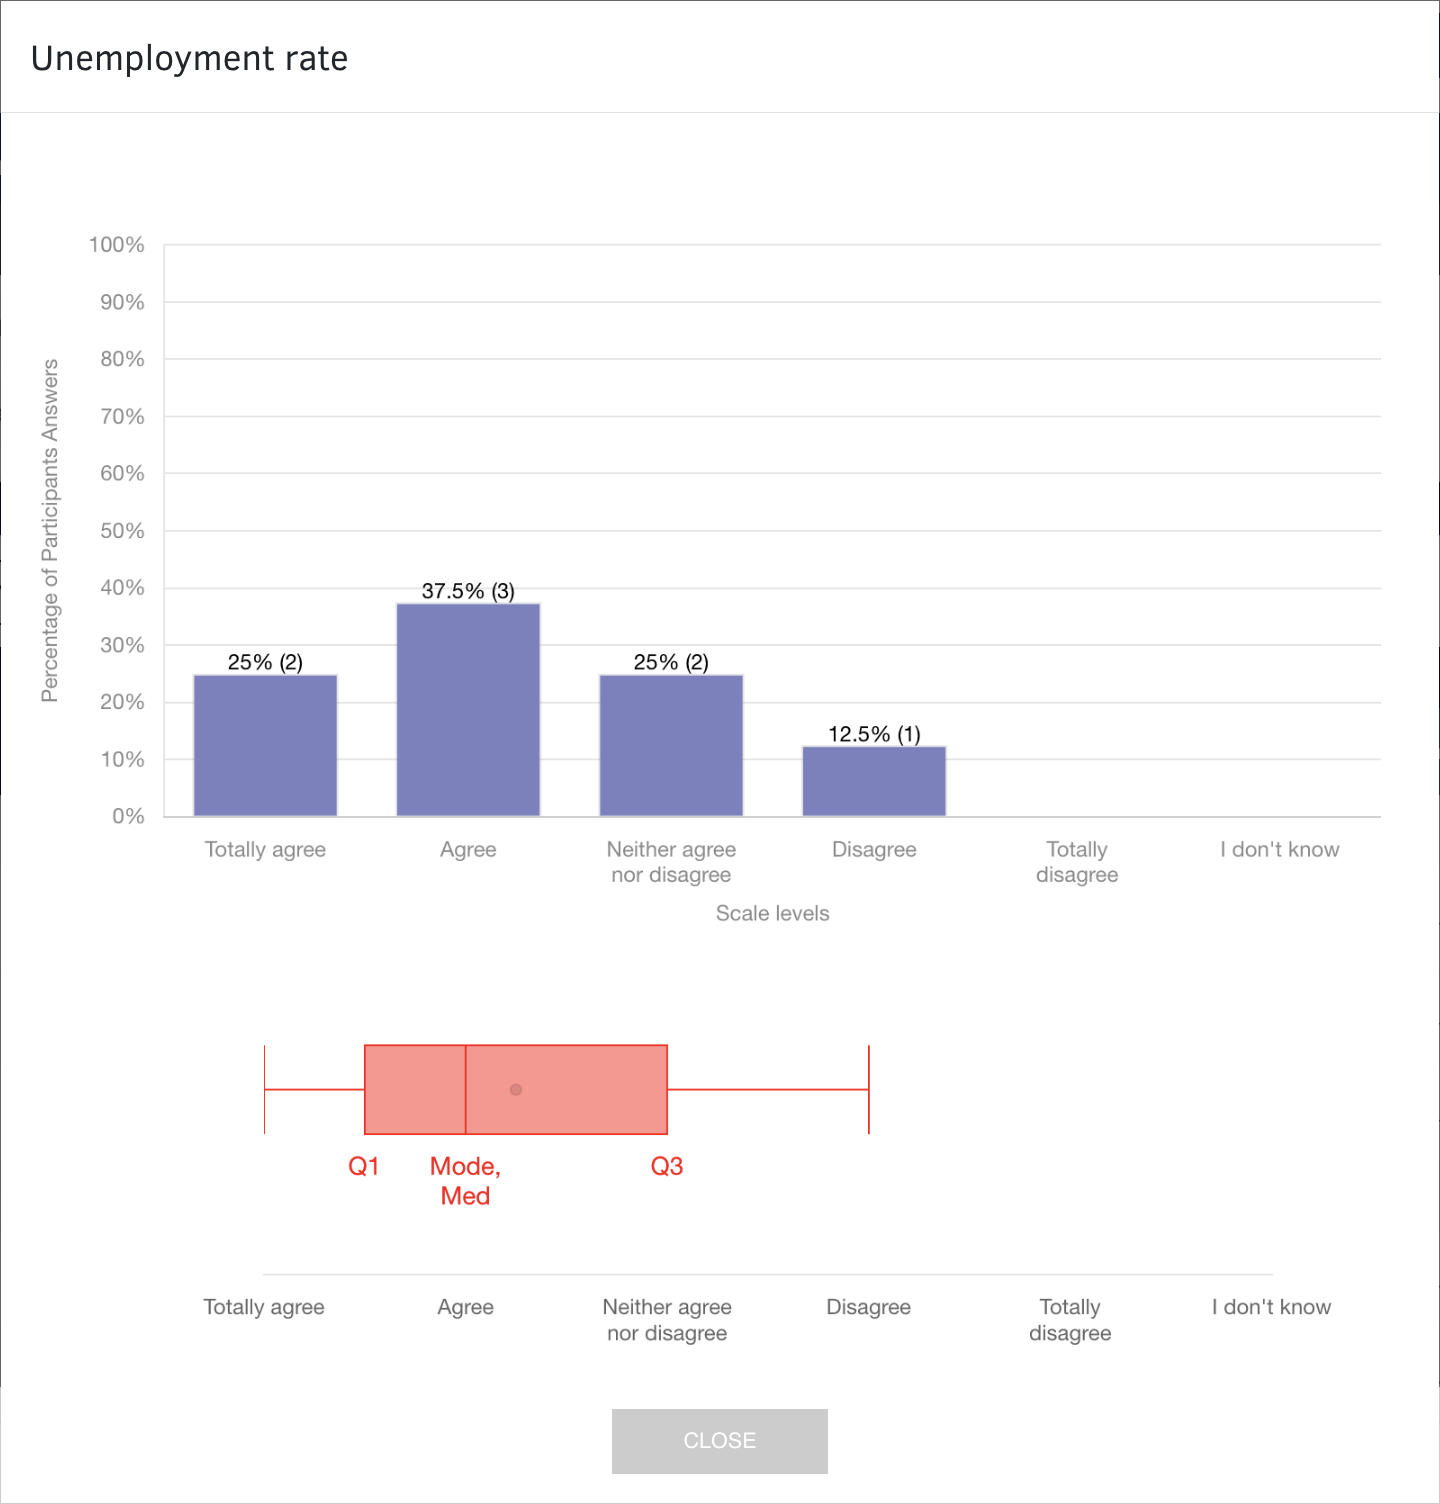
Click the chart icon in the "Histogram" column to see one indicator in detail:
- Bar chart – the percentage and number of answers for each scale level.
- Box plot – where Q1, the mode, the median and Q3 fall on the scale.
Stability between rounds (Wilcoxon Signed-Rank)
From round 2 on, the table ends with the "Wilcoxon Signed-Rank" columns. They compare each participant's answer in this round with their own answer in the previous round, to show whether the group's opinion is still changing:
- p-value – the result of the Wilcoxon signed-rank test for the indicator.
- Consensus (p-value ≥ 0.05) – "Stable" when the p-value is 0.05 or more: the answers did not change significantly since the previous round. "Unstable" when it is below 0.05: participants moved their answers between rounds.
The columns only appear when the page is linked to the same page in the previous round (the link icon next to the page on the "Round details" screen). This is the case when you create the next round with "NEW ROUND +", which copies the pages.
Example: two rounds with the same six participants
- Life expectancy at birth – nobody changed their answer: p-value 1.0000, "Stable".
- Infant mortality rate – two participants moved one level towards "Totally agree": p-value 0.1573, still "Stable".
- Unemployment rate – every participant moved one level towards "Agree": p-value 0.0143, "Unstable".
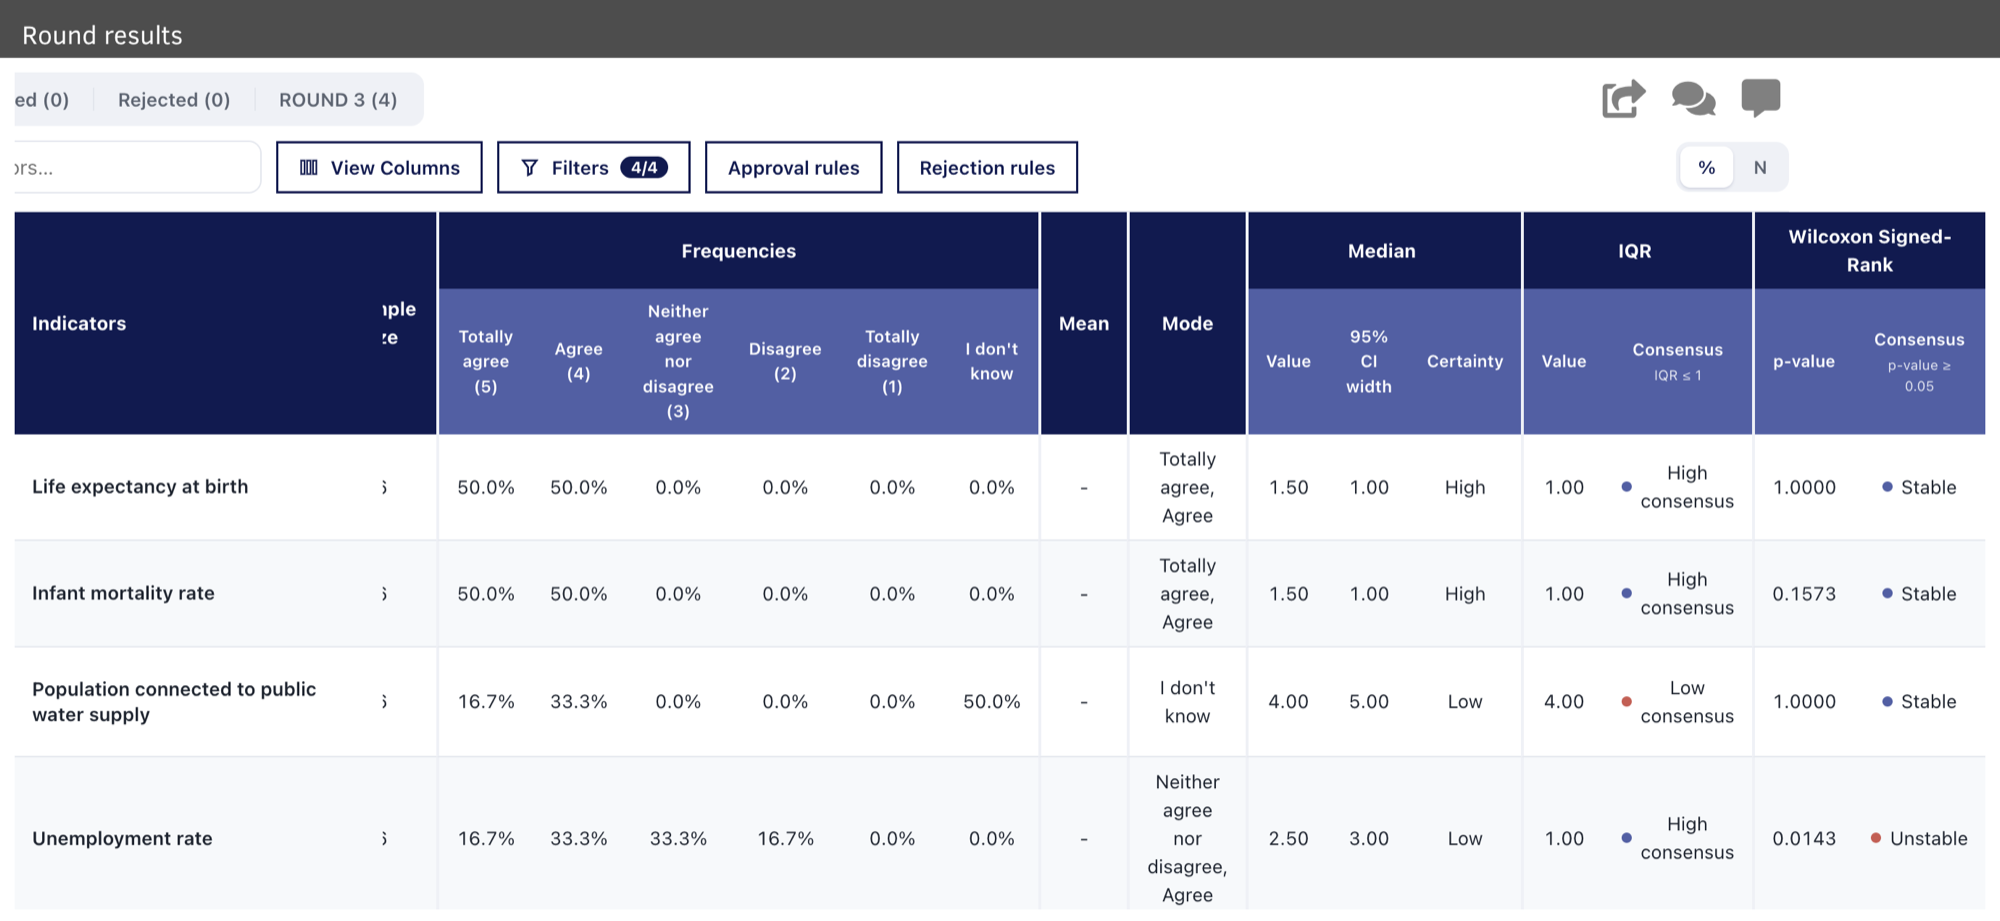
Read stability together with consensus. "Unemployment rate" has "High consensus" in round 2 (IQR 1.00), but its answers are still moving, so you may want another round before you approve it.
3. Narrow down the list
- Section and Subsection – show only the indicators of one group. These buttons come from the indicator custom fields you used to group and subgroup the page.
- Search indicators – find an indicator by name.
- View Columns – choose which columns to show (Histogram, Sample Size, Frequencies, Mean, Mode, Median, IQR). Click "Clear all" to hide them all, and "Done" to close.
- Filters – show only the indicators that meet a condition, for example "IQR ≤ 1". The button shows how many indicators are visible (for example "22/22").
Filters are also the easiest way to design a rule: try conditions as filters, see which indicators remain, and turn the filter into a rule when you are happy with it.
To add a filter, click "Filters", then "Add Filter", and build the condition in the same way as a rule condition (see step 5). Click "Delete All Filters" to remove them. When a filter is useful, click "Turn into rule" and choose "Turn into approval rule" or "Turn into rejection rule".
4. Exclude "Unable to rate" answers from the statistics
Many scales include a level such as "Unable to rate", "I don't know" or "No opinion", for participants who don't feel able to judge an indicator. These answers are not an opinion on the scale, so they should not count when you calculate the median, the IQR or the level of consensus.
In the statistics table
- Click "Filters" and then "Add Filter".
- In the first box, choose "Exclude".
- In the second box, choose the level, for example "I don't know".
The level disappears from the "Frequencies" columns, and the answers with that level no longer count in the sample size, the frequencies and the statistics.
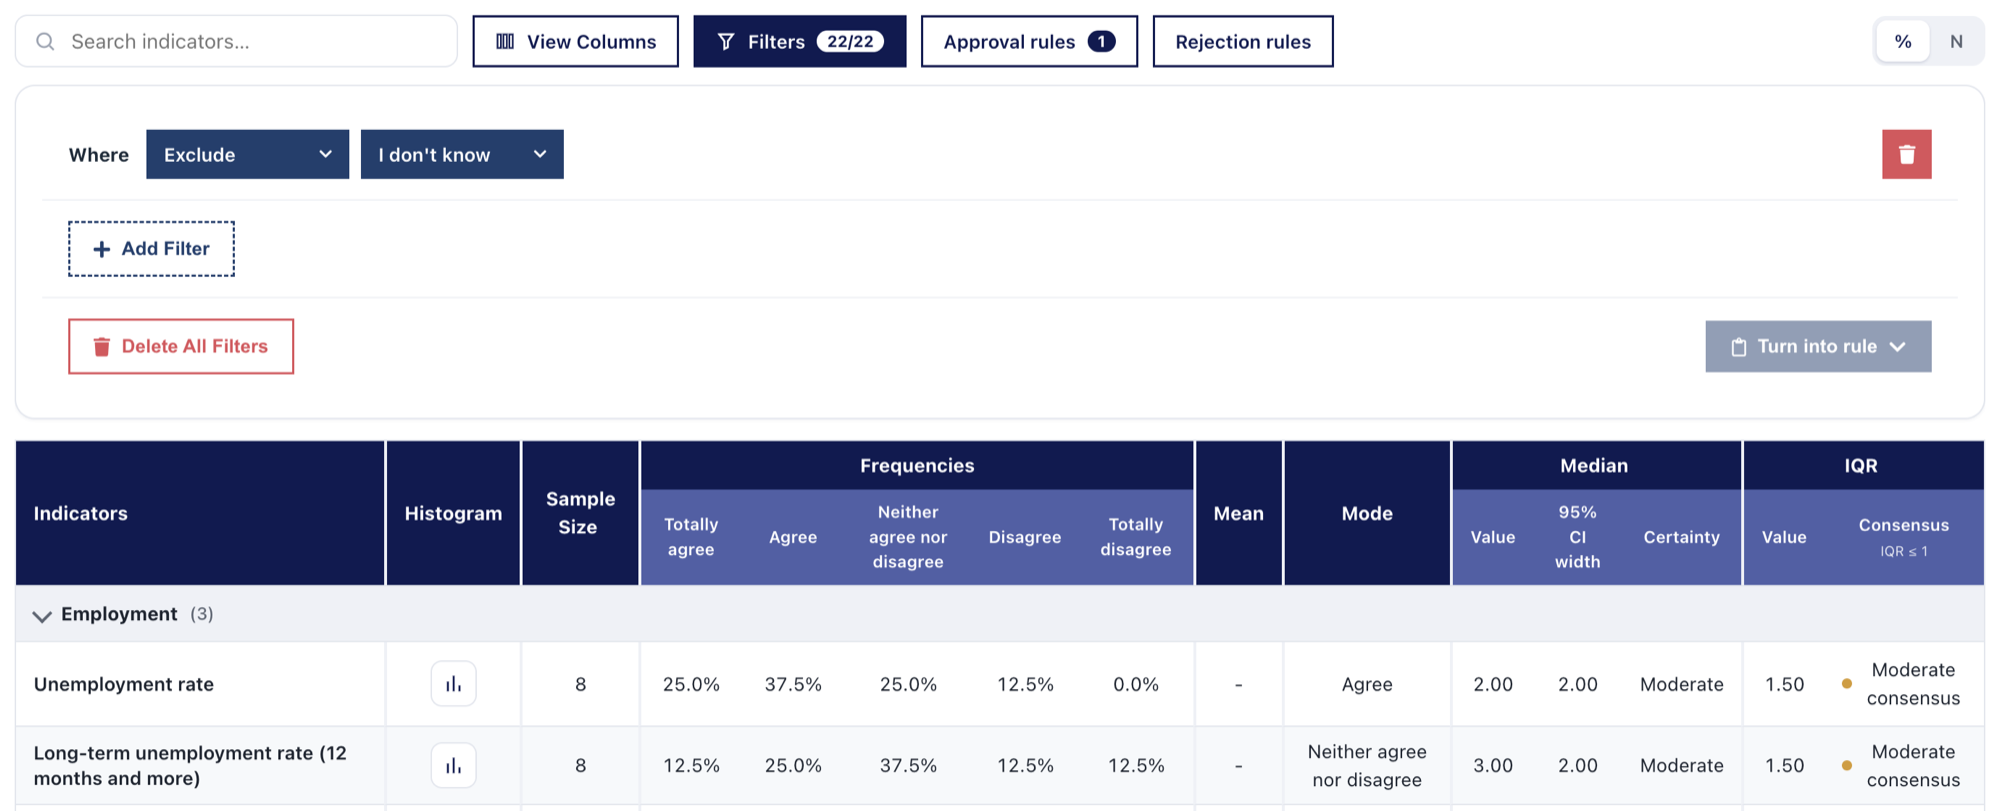
Example: the same answers, with and without "I don't know"
Six participants rated "Population connected to public water supply": one chose "Totally agree", two chose "Agree" and three chose "I don't know".
Without the filter, the "I don't know" answers count as a sixth level of the scale:
- Sample Size – 6.
- Mode – "I don't know".
- Median – 4.00, and IQR – 4.00: "Low consensus".
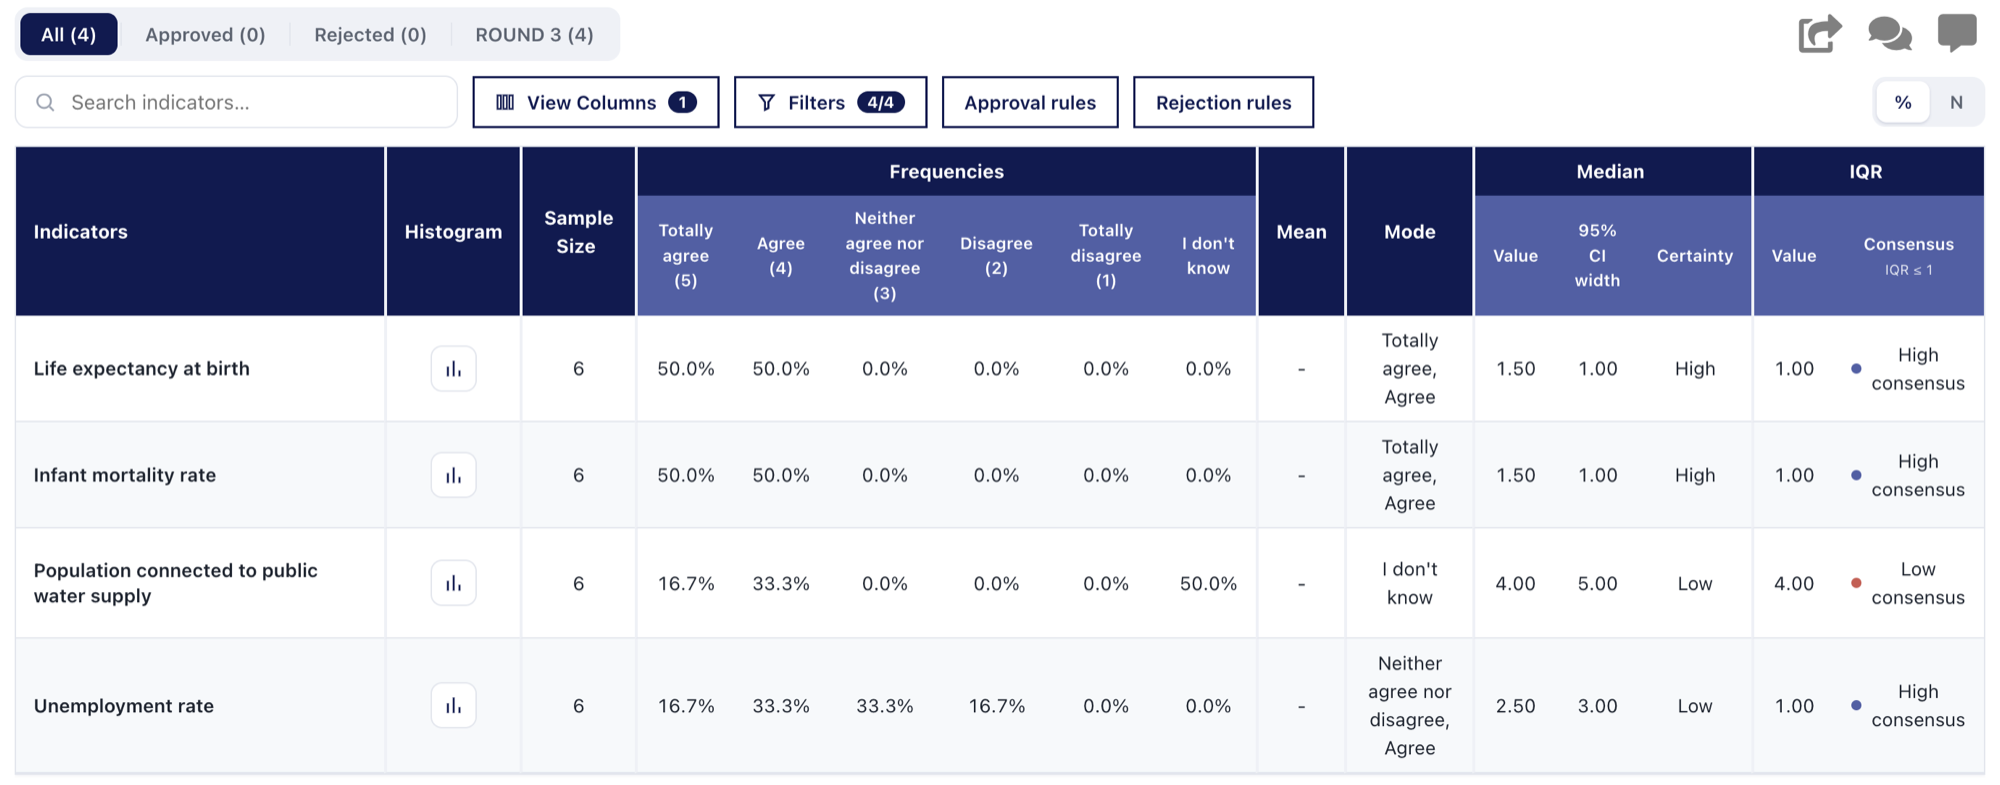
With the filter "Exclude I don't know", only the three participants who gave an opinion count:
- Sample Size – 3.
- Mode – "Agree".
- Median – 2.00, and IQR – 1.00: "High consensus".
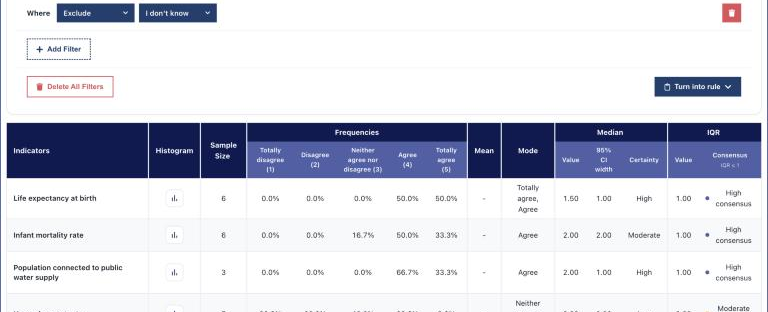
The indicator goes from "Low consensus" to "High consensus": the participants who rated it agree with each other, and the three "I don't know" answers had hidden that.
In your rules
Rules are calculated separately from the table, so add the same exclusion to every rule:
- Make "Exclude" and the level the first condition of the rule ("Where Exclude I don't know").
- Or, if you already have the filter, click "Turn into rule": the new rule starts with the same conditions, including the exclusion. The filter is then removed from the table, so the table goes back to counting "I don't know" answers until you add the filter again.
Please keep in mind: if you leave the exclusion out, "Unable to rate" answers count as answers on the scale and can change the median and IQR of an indicator, and so whether it is approved or rejected.
5. Create approval and rejection rules
Rules mark indicators as approved or rejected automatically, and decide how they appear in the next round. Create approval rules with "Approval rules" and rejection rules with "Rejection rules"; both work in the same way.
Create a rule
- Click "Approval rules" (or "Rejection rules") and then "ADD NEW RULE".
- In "Select next round behaviour", choose what happens to the indicators that match the rule: - Visible without voting – participants see the indicator in the next round, but cannot vote on it again. - Hidden – the indicator does not appear in the next round.
- In "Select Color", choose the colour that marks the matching indicators in the table.
- Under "Create Rule", click "+ Add Condition" for each condition. The first condition starts with "Where"; join the others with "and" (all conditions must be met) or "or" (at least one must be met).
- Click "SAVE".
Building a condition
Each condition is built from boxes, from left to right:
- What to measure – a statistic ("Mean", "Median", "Mode", "Sample Size", "Q1", "Q3", "IQR"), the frequency of a scale level (for example "Agree"), or a participant detail ("Group"). Choose "Exclude" to leave a scale level out (see step 4).
- Operator – a comparison (">", "<", "≥", "≤", "=", "≠"), or an arithmetic operator ("+" and others) to combine values, for example the frequency of "Totally agree" + "Agree".
- Value – choose "Custom number…" and type a number, or compare with another statistic.
Use the trash icon to delete a condition, or "Delete All Conditions" to start again.
Example: approve indicators with consensus on agreement
This rule approves the indicators where participants agree with each other (IQR ≤ 1) and most of them agree or totally agree (median ≤ 2, on a scale where 1 = "Totally agree" and 2 = "Agree"), ignoring "I don't know" answers:
- Where Exclude – I don't know
- and IQR ≤ 1
- and Median ≤ 2
- Next round behaviour: Visible without voting
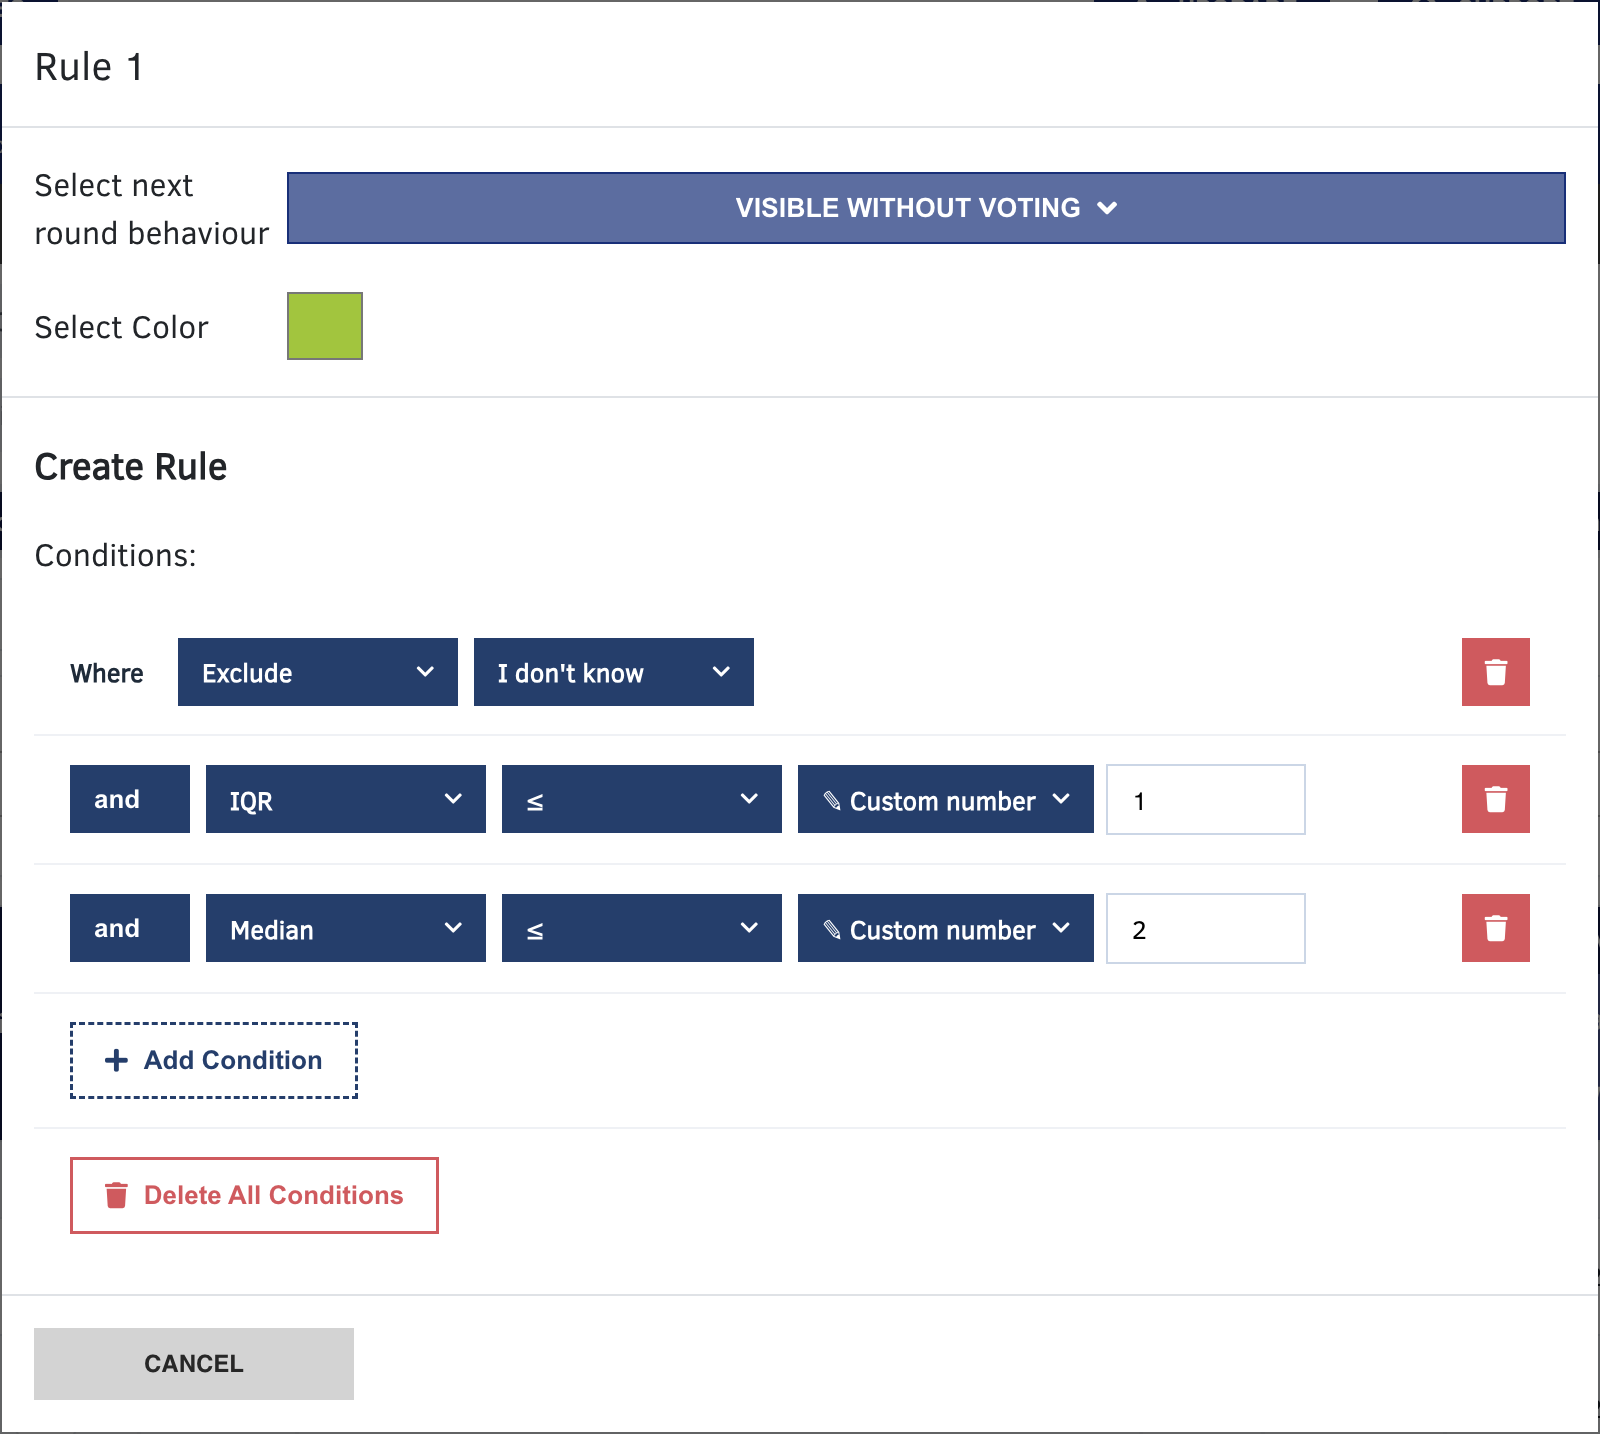
After you save, the rule appears in the list as "Rule 1", with the number of matching indicators in brackets. Use the pencil icon to edit a rule and the ✕ to delete it.
Please keep in mind: while the round is still running, you can create rules but not change or delete them. The pencil icon then only shows the rule, and there is no ✕. To adjust a rule, wait until the round is closed. Until then, try your conditions as filters first (see step 3).
6. Check which indicators go to the next round
The tabs at the top of the page show:
- All – every indicator on the page.
- Approved – the indicators that match an approval rule, marked with the rule's colour and name.
- Rejected – the indicators that match a rejection rule.
- Next round (for example "ROUND 3") – the indicators that will appear in the next round. This includes the indicators to be voted again (every indicator that matches no rule), and the indicators already under consensus that you chose to keep visible without voting.
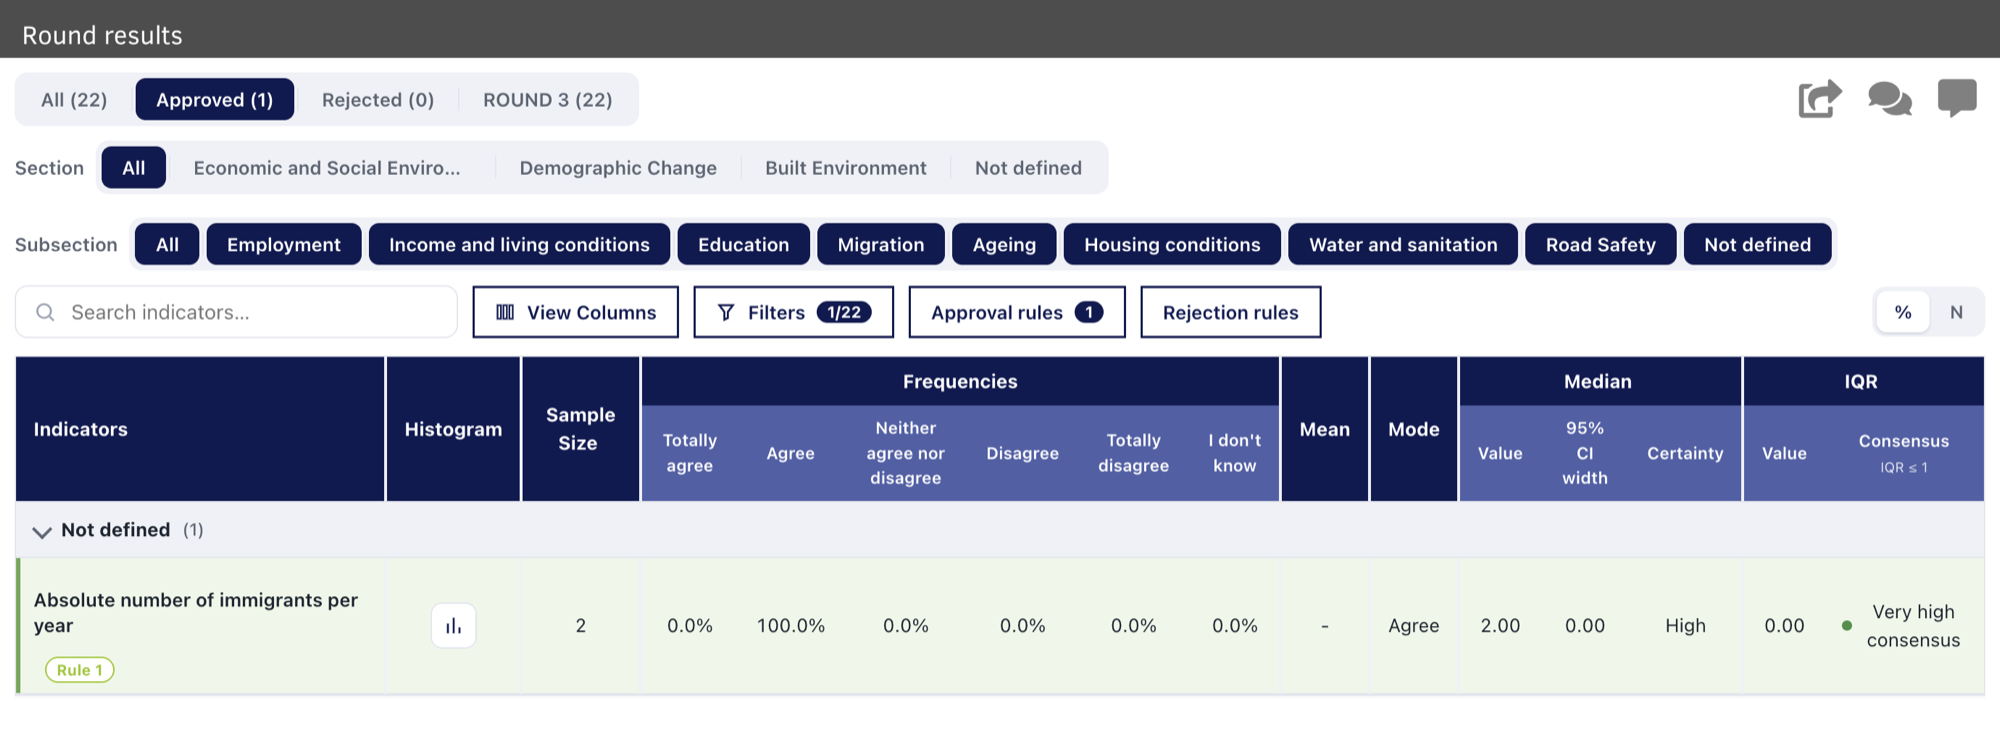
Check these tabs before you create the next round with "NEW ROUND +". Please keep in mind that the current round must be closed before you can start the next one: click "STOP" on the current round's "Round details" screen. Until then, the next round's "Round details" screen has no "START" button, and participant links still open the current round.
To learn more about follow-up rounds, see Setting up a qualitative (fixed scale) page.